best XAUUSD signals for dollar strength volatility
The best XAUUSD signals for dollar strength volatility on March 11, 2026, are derived from a NEUTRAL institutional bias. With the DXY firm at 98.80 and the Federal Reserve in a data-dependent pause, signals must focus on identifying liquidity sweeps and range-bound opportunities rather than chasing directional breakouts, which are prone to failure in this environment.
The Institutional Mechanics Behind best XAUUSD signals
Understanding the current XAU/USD price action requires a dissection of institutional mechanics, not just surface-level technicals. The prevailing NEUTRAL bias is a product of a deeply conflicted macroeconomic environment, creating the exact dollar strength volatility that stops out under-informed traders. Smart money is not aggressively directional here; it is tactical, exploiting the volatility created by fundamental crosscurrents.
The core conflict is between a hawkish reality and a dovish hope. The 10-Year Treasury yield stands at 4.14%, a significant figure that increases the opportunity cost of holding non-yielding bullion. This provides a constant, powerful headwind for XAU/USD. Simultaneously, the Federal Reserve's stance—a data-dependent pause with the Fed Funds Rate at 3%—injects extreme uncertainty. Every major data release has the potential to violently shift rate expectations, sending the DXY (currently 98.80) on volatile swings. This dynamic is the engine of the current market character.
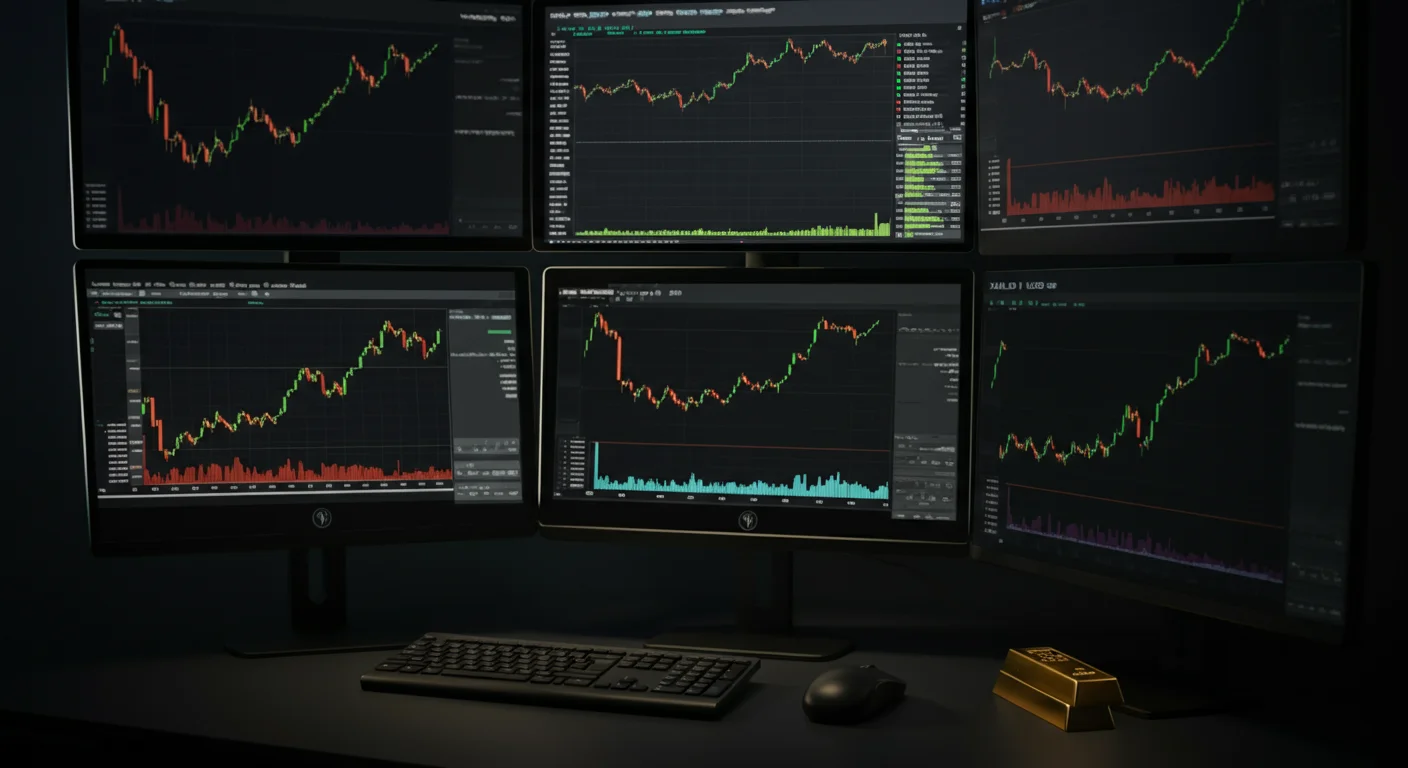
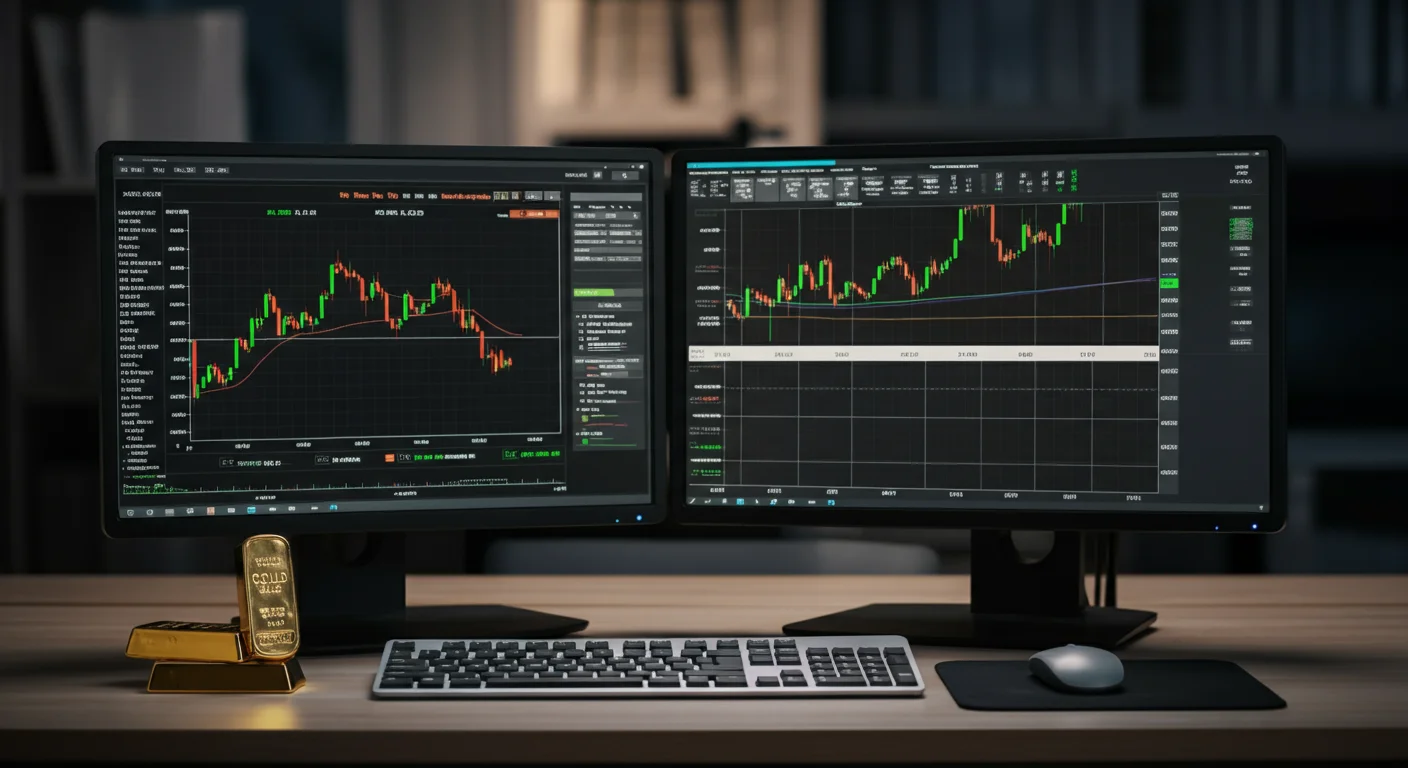
Commitment of Traders (COT) data further illuminates this institutional stalemate. A review of net COT positioning reveals a smart money divergence. Non-commercials (large speculators) are likely holding a diminished net-long position, cautious of the high yields and strong dollar. Conversely, commercials (producers and swap dealers) are likely increasing their net-short positions to hedge against price downside. This lack of consensus is a hallmark of a consolidating, range-bound market. The ForexFundAI platform’s COT dashboard provides a visual representation of this dynamic, confirming the absence of a unified institutional drive.
This environment is ideal for the formation of liquidity pools. As price oscillates within a range, buy-stop liquidity builds above recent highs and sell-stop liquidity accumulates below recent lows. Institutional algorithms are engineered to target these zones. The observed “dollar strength volatility” is not random; it is often the precise mechanism used to engineer liquidity sweeps, clearing out stops before a potential reversal. Therefore, the best signals are not those that predict a breakout, but those that anticipate the failure of one.
March 11, 2026 Macro Snapshot: Key Data Points
| Indicator | Current Reading | Institutional Signal | Impact on XAU/USD |
|---|---|---|---|
| DXY (Dollar Index) | 98.80 | Bullish for USD | Bearish Headwind. A strong dollar makes gold more expensive for holders of other currencies, creating persistent selling pressure. This level acts as a cap on significant upside momentum for XAU/USD. |
| 10-Year UST Yield | 4.14% | Bearish for XAU | Strong Bearish Headwind. This high yield on a risk-free asset makes holding zero-yield gold unattractive for large capital allocators. It represents a significant opportunity cost that weighs heavily on the precious metal. |
| Fed/CB Stance | Federal Reserve in a data-dependent pause, Fed Funds Rate held at 3%. | Neutral / Volatility Driver | Source of Uncertainty. The market is trapped between pricing in the next move. Hawkish inflation data could spike yields and the DXY, crushing gold. Dovish employment data could do the opposite. This indecision fuels volatility. |
| Geopolitical Risk | Conflict between strong underlying fundamental support and potent near-term headwinds. | Elevated Safe-Haven Demand | Bullish Support. Underlying geopolitical tensions provide a foundational bid for gold as a classic safe-haven asset. This is the primary force preventing a more substantial sell-off in the face of high yields and a strong dollar. |
| COT Net Positioning | Inferred Divergence: Speculators cautious, Commercials hedging. | Neutral / Non-Consensus | Confirms Stalemate. The lack of a unified position between smart money players (speculators vs. hedgers) indicates institutional indecision. This is a classic sign of a market that is likely to remain in a range. |
| XAU/USD Spot | 2026.00 | AI Bias: NEUTRAL | Equilibrium Point. The current spot price reflects the perfect balance of the bullish geopolitical bid against the bearish pressure from yields and the DXY. The AI Gatekeeper's NEUTRAL bias is a quantitative synthesis of these conflicting forces. |
5 Institutional Steps to Trade Best Xauusd Signals For Dollar Strength Volatility in March 2026
Navigating the current XAU/USD landscape requires a tactical, patient approach that aligns with institutional order flow. Forcing a trade in this NEUTRAL environment is a low-probability endeavor. The following five steps outline a precise methodology for engaging with the market on March 11, 2026.
- ▸
Identify and Map Key Liquidity Zones. Before any trade is considered, the primary task is to map the battlefield. On a 4-hour or 12-hour chart, identify the clear swing highs and swing lows that define the current trading range. These levels are where buy-stop and sell-stop liquidity are accumulating. These are not entry points; they are kill zones for retail breakout traders. The objective is to note these prices as areas of future interest for a potential liquidity sweep.
- ▸
Wait for a Volatility-Induced Liquidity Sweep. Patience is the primary strategic asset. Do not place trades within the 'chop' of the range. The institutional play is to wait for a sharp, volatility-driven move—often triggered by a news event or session open—that pushes price beyond one of the identified liquidity zones. For example, a push below a key swing low that takes out the sell-stops resting there. The key is that this move should look like a breakout to the untrained eye.
- ▸
Confirm Entry on a Market Structure Shift and Fair Value Gap (FVG). The signal is not the sweep itself, but the rejection that follows. After price sweeps the liquidity, watch for a rapid reversal and a break of the short-term market structure that created the sweep (a 'market structure shift'). This reversal often leaves behind a 'Fair Value Gap' (FVG)—a price imbalance on the chart. An institutional entry is placed within this FVG, anticipating that price will return to rebalance it before continuing the reversal move back into the established range.
- ▸
Place Stop Loss Outside the Sweep High/Low. This is the critical step that addresses the trader pain point of being stopped out by volatility. The stop loss must be placed logically outside the zone of the liquidity sweep. If price swept a low at $2015, the stop loss for a long position should not be at $2014. It should be placed at a structurally sound point below the absolute low of the sweep, giving the trade room to breathe and protecting it from the very volatility it seeks to exploit.
- ▸
Target Liquidity on the Opposite Side of the Range. Once entered into a position following a confirmed sweep and reversal, the take profit target should be logical and data-driven. The primary target is the liquidity pool resting on the opposite side of the trading range. For instance, a long trade initiated after a sweep of the lows would target the buy-stop liquidity resting above the range highs. Secondary targets can be placed at significant institutional order blocks within the range, which represent areas of potential resistance.
The Retail Trap: Common Mistakes in This Setup
This specific macro environment, characterized by a NEUTRAL bias and high DXY volatility, sets several traps for undisciplined traders. Understanding these pitfalls is the first step to avoiding them.
First is the impulse to trade breakouts. With price coiling, the temptation to front-run a breakout from the range is immense. Retail traders place buy stops above highs and sell stops below lows, hoping to catch the 'big move'. In this environment, these are the very orders that constitute the liquidity pools targeted by institutional algorithms. The breakout fails, stops are hit, and price reverses, leaving the breakout trader with a loss.
Second is chart myopia: ignoring macro correlation. Many traders focus exclusively on the XAU/USD chart, failing to keep a constant watch on the DXY and the 10-Year Treasury yield. A beautiful bullish setup on gold can be instantly invalidated by a sudden 20-basis-point spike in the 10-year yield to 4.34% or a surge in the DXY towards 99.00. In this market, the DXY and yield charts are as important as the gold chart itself.
Third is illogical stop loss placement. The most common mistake is placing a stop loss just inside a key support or resistance level. This places the stop directly within the liquidity zone that is most likely to be tested. For example, placing a stop loss for a long position just above a clear support level is an invitation for it to be triggered during a liquidity sweep before price moves higher. The stop must be placed based on market structure, outside the area of expected volatility.
ForexFundAI: Institutional Intelligence, Retail Access
This complex, conflicted market is precisely where an algorithmic, data-driven approach demonstrates its value. The ForexFundAI platform is engineered to cut through the noise of volatility and identify high-probability setups based on the same institutional logic outlined above. This is achieved through a proprietary 3-layer validation process.
Layer 1: Macro Fundamental AI. The first layer is a macro AI that quantifies the narrative. It analyzes the Federal Reserve's data-dependent pause, the impact of a 4.14% 10-year yield, and the DXY's position at 98.80. It synthesizes these conflicting inputs to generate the definitive NEUTRAL bias, preventing traders from forcing a directional trade when none exists. This AI gatekeeper ensures that any issued signal is consistent with the dominant macroeconomic regime.
Layer 2: Institutional Order Flow Mapping. The second layer translates the macro bias into actionable trade parameters. The platform’s algorithms continuously scan the XAU/USD chart, automatically identifying critical order blocks, fair value gaps (FVGs), and liquidity pools. When the system detects a liquidity sweep followed by a market structure shift, as described in the 5-step process, it flags a potential entry. This removes the guesswork and subjectivity from identifying these precise zones. These are the same zones that power our live gold signals, delivered with entry, stop loss, and take profit levels.
Layer 3: COT Confirmation. Before a signal is finalized, it is cross-referenced with our Commitment of Traders (COT) visual dashboard. In the current environment, the dashboard confirms the divergence between commercial and non-commercial positioning, reinforcing the NEUTRAL, range-bound thesis. A signal to go long would require a shift in this dynamic, such as non-commercials aggressively adding to their net-long positions. This final check ensures trades are not taken against the prevailing smart money flow.
This three-tiered system, which can be automated via our MT5 Expert Advisor (
ForexFund_AutoTrader.mq5Join 2,000+ professional traders relying on ForexFundAI for institutional-grade macro intelligence — explore plans from $30/mo.
For more analysis on macroeconomic drivers and institutional trading strategies, visit our More Market Insights section.
Risk Disclaimer: Forex and commodities trading carries substantial risk of capital loss. Past signal performance does not guarantee future results. Signals are not financial advice. Only allocate capital you can afford to lose in full. Full risk disclosure.